
About
Representation
View all Representation →Consultations- Digitisation Taskforce – Final Report
- FCA Consults on Fund Product Information and Cost Disclosure CP24/30 – ShareSoc Responds
- FRC Consults on UK Stewardship Code – ShareSoc Responds
- FCA Consultation – Modernising Redress
- HMRC Consultation – IHT on Pensions
- ShareSoc Evidence to Lords on FCA Enforcement
- ShareSoc supports FCA proposal for criminal background checks on owners and controllers of financial institutions
- UK ISA: ShareSoc submits consultation response
- FCA Consultation on Enforcement Practice & Transparency
- ShareSoc response to House of Commons Education Select Committee
- UKSA and ShareSoc Submission to Labour Party Review of Financial Services
- FCA Consultation GC23/2 Financial Promotions on Social Media
- VIEW ALL CONSULTATIONS
Education
Events
- Forums
Funds should not be judge and jury of their benchmarks
The ShareSoc blog provides news and informal commentary from directors, members and other contributors. Entries reflect the personal views of the authors, which do not necessarily reflect ShareSoc’s formal position. Contributors may hold shares in the companies mentioned. Nothing in this blog should be viewed as financial advice. You may submit comments on blog posts, but ShareSoc reserves the right to remove or edit inappropriate or defamatory submissions.
This article reflects the opinions of its author and not necessarily those of ShareSoc.
Royal London marketing email re profit sharing prompts Cliff Weight to investigate the real investor costs and compare/contrast them to actual performance Vs. standard benchmarks (always key).
As Royal London is a mutual, without the need to make large profits and pay dividends to shareholders, one might be tempted to think they might have lower fees and, net of fees, might outperform other fund managers. When I received their email about their profit share with customers (£1bn so far; at around 0.15% of your investments p.a.), I was attracted and looked further.
I started my analysis with their global fund (My recent blog on performance measurement explained why this is where you should start, see https://www.sharesoc.org/blog/investment-strategies/risk-returns-and-optimising-performance/ ).
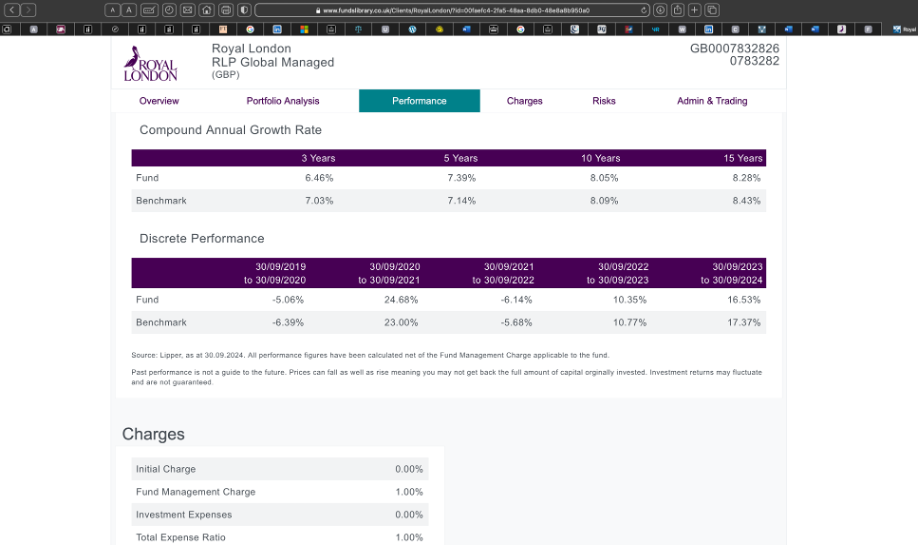
The 15 year performance is quoted as 8.28% (p.a. compound annualised net of fees) compared to its “benchmark” of 8.43%. Using the Royal London data and benchmark, the 15 year underperformance after charges (RL charge 1% pa.), is 0.29% p.a. (n.b. this compounds to 4.4% after 15 years).
However, I think the most relevant benchmark is the MSCI Global Index. Its performance has been:
The MSCI World index has had the following average annualized returns (in $) over different periods:
- Last year: 25.3%
- Last 5 years: 12.4%
- Last 10 years: 11.4%
- Last 15 years: 12.3%
Source Google.
If you had bought a tracker in the MSCI World Index, it would cost about 0.10% p.a. in fees, so the 15-year return would reduce to 12.2%. I estimate this in sterling terms is 13.8%. (This is because the £ has been a bad investment since the end of WW2 when it was $4.80 to the £. In the 15-year period 2009-2023 it lost 25%, i.e. 1.5% p.a. on average compound.) So, the Royal London underperformance is 5.5% p.a., which over 15 years compounds to 123%!
So, not only are you paying 1% p.a. fees, but historically have underperformed the Global MSCI by over 5% p.a. Suddenly the “good news” about profit sharing becomes clear. It is a marketing ploy to tempt you to invest.
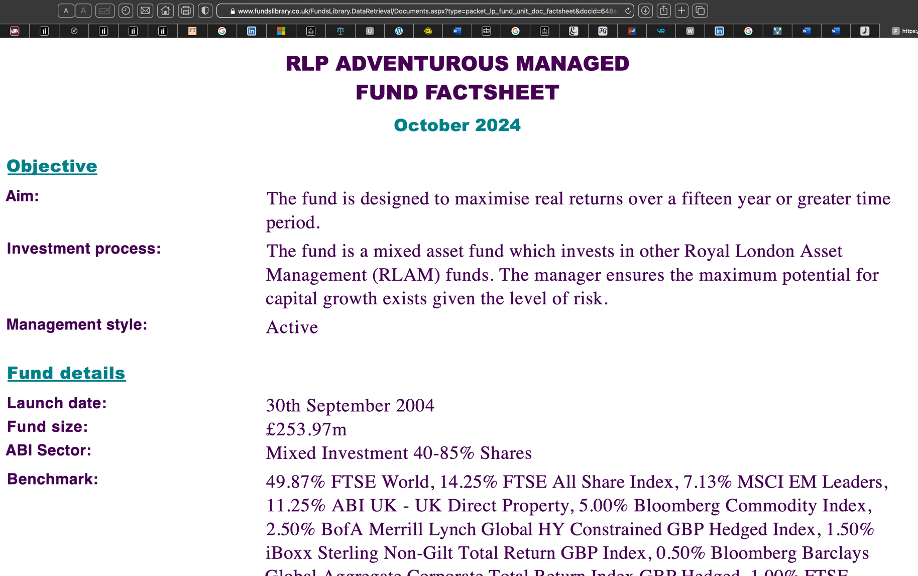
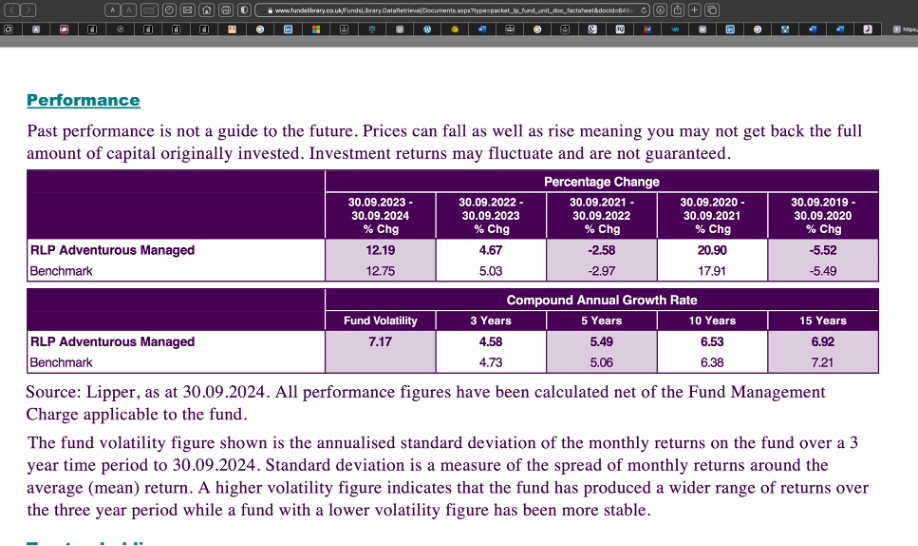
Royal London has many funds which it promotes. The exotically named RLP “Adventurous Managed Fund” says it is designed to maximise real returns over a 15 year or greater period. Its 15 year performance averages 6.92% p.a., which it compares to the RL chosen benchmark of 7.21%. However, the RL choice of “benchmark” is home biased (i.e. UK biased). This RL fund has underperformed the Global MSCI index tracker by nearly 7% p.a. I prefer the un-adventurous index tracker!
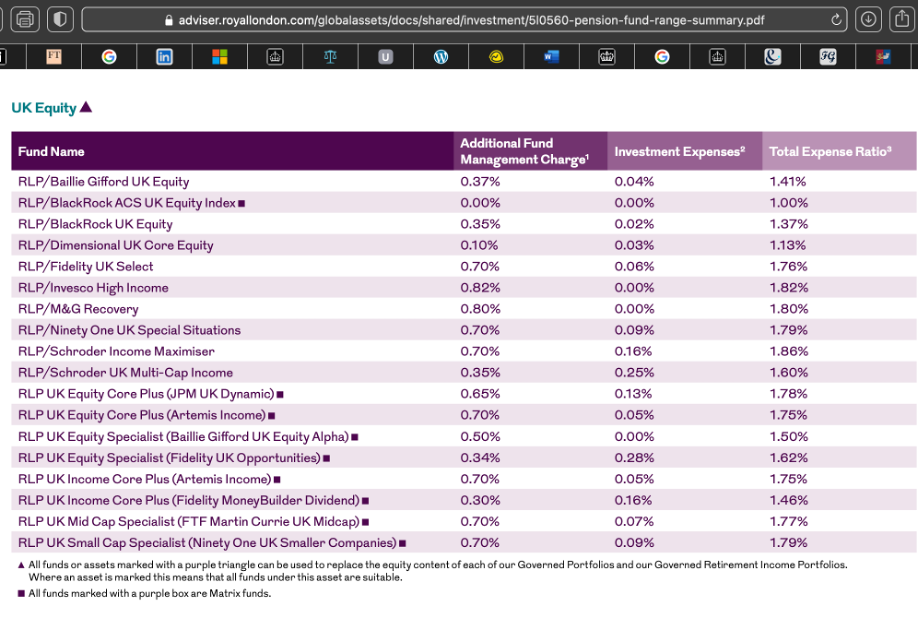
RL also offers third party funds. These have even higher charges and will have to outperform significantly to beat an index tracker. The 0.15% profit sharing will not offset these high charges.
Please note that the benchmarking issue is systemic and certainly not limited to Royal London. Woodford, for example, chose the FTSE100 as his benchmark for the WEIF, despite it having lots of overseas quoted shares and at times 20% in illiquid or unquoted shares.
My conclusions are:
- Fund charges are important, but underperformance can be far more important and more damaging to your personal wealth.
- The FCA needs to get a grip on this situation. The FCA should write a Dear CEO letter to fund managers reminding them of their Duty of Care to their customers and telling them to consider their choice of benchmarks and requiring them to also include in their comparative performance data a Global Equity benchmark, such as the Global MSCI.
Cliff Weight, ShareSoc member, former Director and currently member of ShareSoc Education Committee and ShareSoc Policy Committee
2 Comments
Leave a Comment Click here to cancel reply.
This site uses Akismet to reduce spam. Learn how your comment data is processed.

Become a free Associate ShareSoc member
Enter your email to sign up as a free Associate ShareSoc member and receive our emails. It takes a few seconds — and on the next page you'll have the option to customise your membership.
Very useful post, thank you.
Just spotted another didgy fund. It charges 1.03%p.a. And says its benchmark was 4.7%p.a. Over 10 years and it achieved 5..6% p.a. After charges. See https://extranet.secure.aegon.co.uk/static/sxhub/pdf/client-life-univbalcollection.pdf