UK STOCK MARKET STATISTICS
SOME BACKGROUND INFORMATION
UK Statistics
This page contains some background information on the UK stock market, and the investors in it, including the role of individual investors. There are two problems with obtaining and analysing this information. One is the difficulty that many shares are now held in nominee accounts, so identifying the beneficial owners is not easy. The second problem is that the sources of such information are patchy and often out of date. But here is what is known:
2020 has so far seen a strong increase in retail investor activity with platforms such as Hargreaves Lansdown, AJ Bell and Interactive Investor experiencing increases in new account openings and inactive accounts reactivating. It is estimated that during March and April 2020 20% of the volume of the FTSE All Share was from retail investors, with over 60% being ‘buy’ orders.
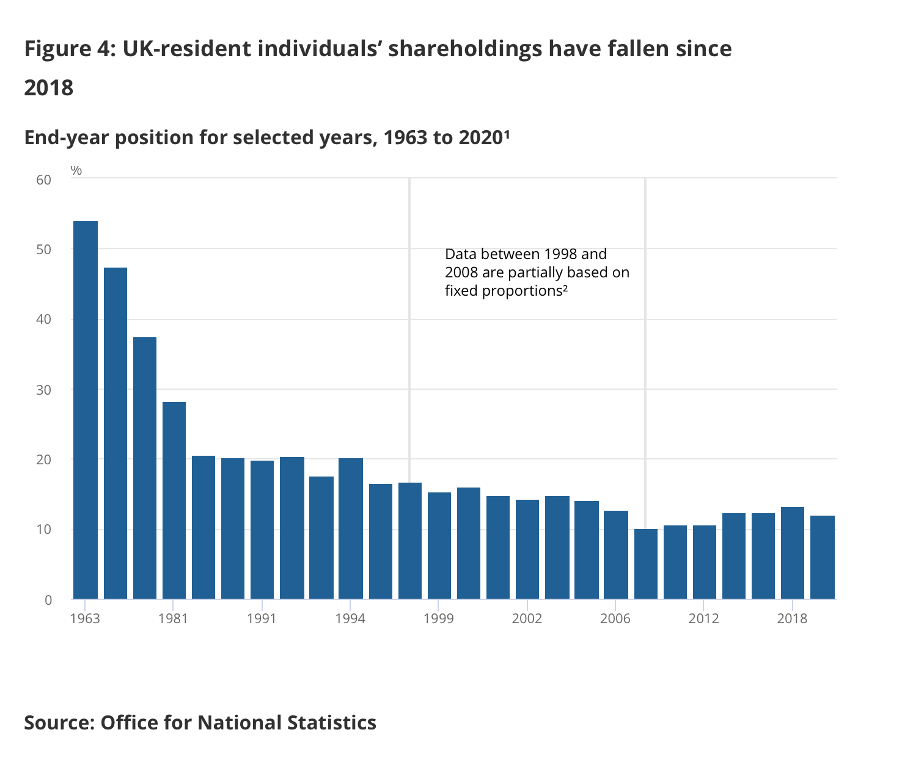
At the end of 2018 UK-resident individuals held 13.5% of the UK stock market, up by 1.2% from 2016 and moving away from the historical lows of 10.2% in 2008[1]. In 2020 the Financial Times estimated that 15% of the UK stock market is held by individual shareholders, in 1963 that number was 50%[2].
The latest ONS data[3], at the end of 2020, reports individuals’ shareholdings stood at 12.0%, down from 13.3% in 2018. The reasons for the reported sharp decrease are unclear. The 13.3 2018 has been restated, it was previously published at 13.5%). The Covid pandemic has been widely linked to increases in individuals starting to invest and hence in share ownership. It is too early for such effects to be seen in the ONS data and also the impact of the recent cost of living crisis on savings levels remains to be seen. Another issue is whether individuals in the UK have diversified their portfolios and now own less UK stocks and more overseas stocks.
The long term trend of declining individual share ownership from more than 50% of the market post WWII is clear, but since the 2008 financial crisis it remains to be seen whether this trend may have reversed or whether the immediate increase post Covid was a temporary reversal of trend.
Retail investors are especially important shareholders for small and mid-cap companies where the ownership rises to 25% of companies listed on the London Stock Exchange’s growth market, AIM[4].
In Europe (including the UK) households own 15.6% of listed shares up from 12.7% in 2007[5]. In Australia the ASX Investor Study 2017 shows that 31% of Australians hold shares directly with the % of younger investors growing[6]. In the United States 37.6% of individuals own stocks[7].
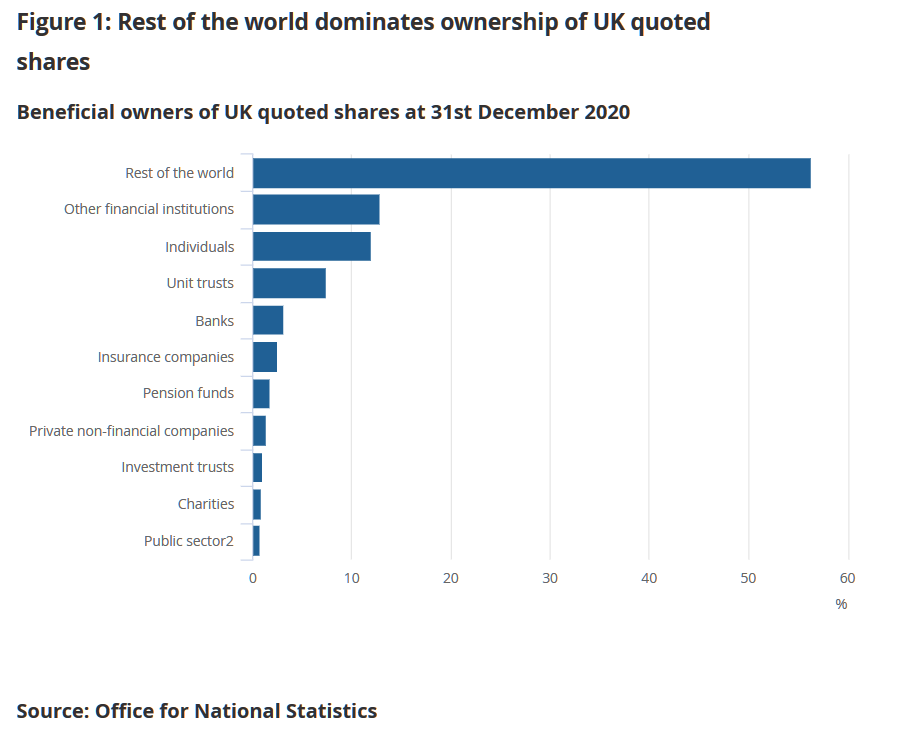
In 2020 the largest proportion of UK shares were held by the rest of the world.
Impact of Nominee Accounts
Nominee accounts and the issue of shareholder rights for those who hold shares in nominee accounts is an important campaign for ShareSoc.
A submission by APCIMS to the Kay Review (based on work by Cass Business School in 2011) suggested that retail shareholders accounted for about 30% of the ownership of FTSE100 companies although it seems likely they took indirect ownership via unit trusts, OEICs, investment trusts and personal pensions into account. It is possible that the aforementioned trend simply represents the migration of shareholders into nominee accounts and into funds and SIPPs. It is likely the 30% is a more accurate representation of the interest of individuals in stock market investment.
Surveys by BIS in 2016 identified that between 3-4% of retail investors hold shares in a personal CREST account. The same report estimated that there are approximately 20,000 CREST personal members nationally, out of an estimated 12 million -13 million retail shareholders in the UK. The Law Commission provided updated statistics in their November 2020 Intermediated Securities Scoping Paper, noting that the number of individuals holding securities directly through CREST has decreased from approximately 50,000 members in 2003 to 4,200 members in 2020.
Meanwhile, the popularity of retail platforms continues to grow, as detailed in UK Secondary Capital Raising Review, Annex H, which details 2.5 million accounts held in Hargreaves Lansdown, Interactive Investor and AJ Bell. In addition, Freetrade have over 1 million accounts, so ShareSoc estimate there are over 5 million platform accounts. Obviously, there is some overlap between the owners of accounts, but we have seen no data on the degree of overlap.
Share Trading Volumes
In 2004 the LSE reported some figures on share trading volumes and at that time private clients created 65% of trades by volume, but only 8% by value. But it is known that the proportion of accounts held by traditional stockbrokers for clients which are “advisory” was falling as opposed to “discretionary” accounts. In other words, fewer and fewer people were making their own investment decisions at that time.
Household Share Ownership
In 2005/6 a survey by the Department of Work and Pensions suggested that 20% of UK households held shares (that suggests as many as 10 million people), but the vast majority held only a few shares which were rarely traded. A survey by Mori in 2002 indicated that 22% of adults held shares, but 12% held only privatised or demutualised shares. The median value of share portfolios was about £5,000 and the median number of companies held was only 3. In 2015 a BIS Department Consumer Omnibus Survey confirmed that 20% of the public held shares directly or via ISAs/SIPPs, equivalent to about 12 million people at that time (see the Paper entitled “Research on the Intermediated Shareholding Model”).
According to the submission by the Shareholder Rights Working Group to the DTI in 2005, there were approximately 4 million people holding nominee accounts, with 23 million shareholdings in those accounts. There were about 40,000 personal Crest members in 2001, with an average value of about £50,000 so these are clearly more substantial investors. But that had fallen to 20,000 investors by 2015 according to the research paper published by the BIS Department. In addition to those numbers there are many people who hold shares in “certificated” form, particularly demutualisation or privatisation holdings. The BIS Paper mentioned above gives more information on the background of investors, how frequently they trade and how they hold their shares.
Retail Investor Accounts
The APCIMS submission to the Kay Review in 2011 suggested there were now 6 million retail investor accounts (although some people may have been holding more than one account). This is supported by information from Compeer published in 2012 who reported that there were 3.5 million execution only nominee accounts, up from 1 million in 2003 – this shows the growth in the use of execution only trading and nominee accounts.
Another statistic that gives figures for the number of private investors is the data for ISA holders. Based on figures from HMRC which are published annually, there were 22.2 million adult ISA holders at the end of 2022, with average savings of £29,387. At the end of 2021 to 2022 the market value of Adult ISA holdings stood at £741.6 billion. This is an 8% increase compared to the value at the end of 2020 to 2021. This was driven by a 14% increase in the market value of funds held in Stocks and Shares ISAs. Stocks and shares ISA holdings account for 62% of the market value of ISAfunds, an increase from 58% in 2020 to 2021. Cash ISAs account for 38% of the market value, a decrease from 42% in 2020 to 2021.
Chart 1 below shows that around 11.8 million Adult ISA accounts were subscribed to in 2021 to 2022, slightly down from 12.2 million in 2020 to 2021. The number of cash ISAs subscribed to decreased by 920,000 compared to 2020 to 2021. The number subscribing to stocks and shares ISAs increased by around 345,000. The share of accounts subscribed to in cash has fallen to 61% of accounts, compared to 66% in 2020 to 2021.
Chart 1: Number of Adult ISA accounts subscribed to during the financial year
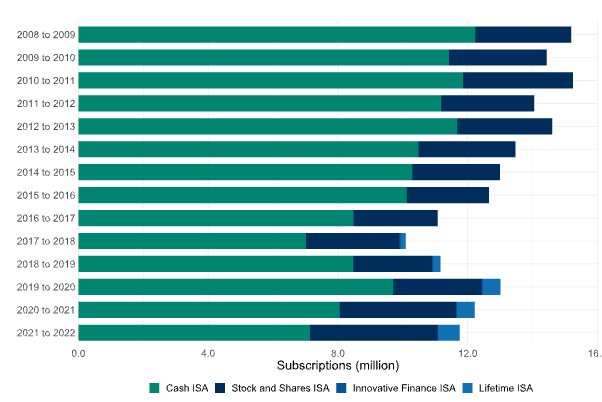
Around 1.2m Junior ISA accounts were subscribed to in 2021 to 2022, the tenth full financial year since the scheme was launched, up from 955,000 in 2020 to 2021.
More information on this can be found within our Shareholder Rights Campaign.
1 https://www.ons.gov.uk/economy/investmentspensionsandtrusts/bulletins/ownershipofukquotedshares/2018#main-points
2 https://www.ft.com/content/b9255dab-385d-4182-8c44-200948bfaae2
3 https://www.ons.gov.uk/economy/investmentspensionsandtrusts/bulletins/ownershipofukquotedshares/2020
4 https://www.ons.gov.uk/economy/investmentspensionsandtrusts/bulletins/ownershipofukquotedshares/2018#main-points
5 Eurostat database, annual sector accounts, financial flows and stocks.
6 https://www.asx.com.au/content/dam/asx/about/media-releases/2017/asx-australian-investor-study-2017-media-release.pdf
7 https://www.sifma.org/resources/research/who-owns-stocks-in-america/
Updated: 28 August 2023