
ShareSoc
INVESTOR ACADEMY
Understanding Compound Interest
A sound understanding of compound interest significantly improves your ability to develop a successful investment strategy that suits you and to correctly evaluate potential investments. Examples of where such an understanding will help you are:

- Calculating the rate of return or yield to maturity of bond investments
- Understanding the sensitivity of investment returns to the return on capital employed (ROCE) that a business can achieve
- The impact that an issue of bonds or preference shares by a business will have on the returns achieved by equity investors.
- Calculating the annualised return your portfolio has achieved and/or working out when a desired target level of capital should be achieved.
In this chapter we explain:
- What the term “compound interest” means
- The impact of time on your expected returns
- The impact of the interest rate on returns
- Tools to help you with compound interest calculations, including a worked example of how a more sophisticated tool is used.
What is Compound Interest?
Simply put, compound interest is interest you earn on interest. For example, consider a bank savings account that pays 2% interest, compounded annually. After one year, an initial investment of £10,000 earns £200 of interest (2% of £10,000) – which means that the amount in the account at the start of the second year is £10,200. So, in the second year, the amount of interest earned will be £204, giving a closing balance of £10,404 (rather than the £10,400 which the account would have grown to, had only simple interest been earned).
The Effect of Time
Time is the investor’s friend. Holding an investment for longer has a much bigger impact on your returns than you would intuitively expect. The following chart shows how an initial lump sum of £10,000, earning 5% compound interest, grows over time.
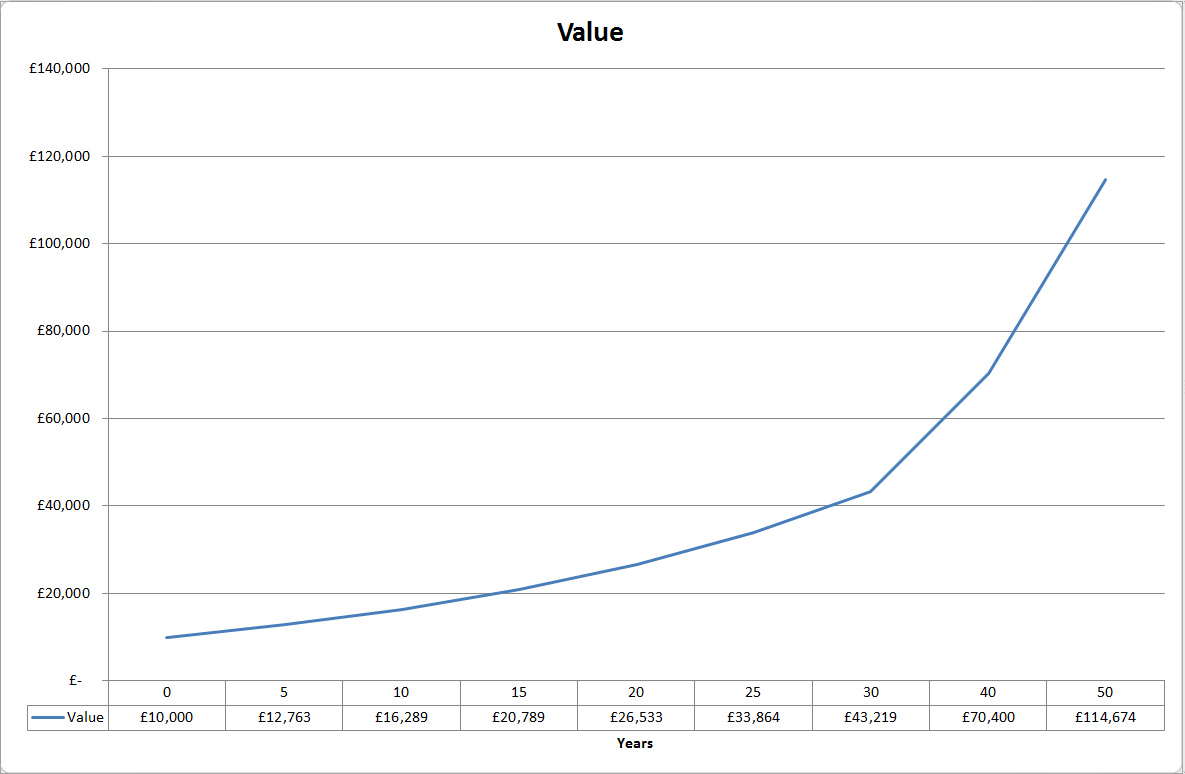
Note how extending the amount of time the money is invested for by a relatively short period dramatically increases the final value obtained. This is a consequence of the geometric nature of compound interest.
The Effect of Interest Rates
Just as extending the duration of an investment has a disproportionate effect on returns, so do relatively small changes to interest rates earned. The following chart illustrates the effect of different interest rates on the ultimate value of an initial investment of £10,000 held for 20 years.
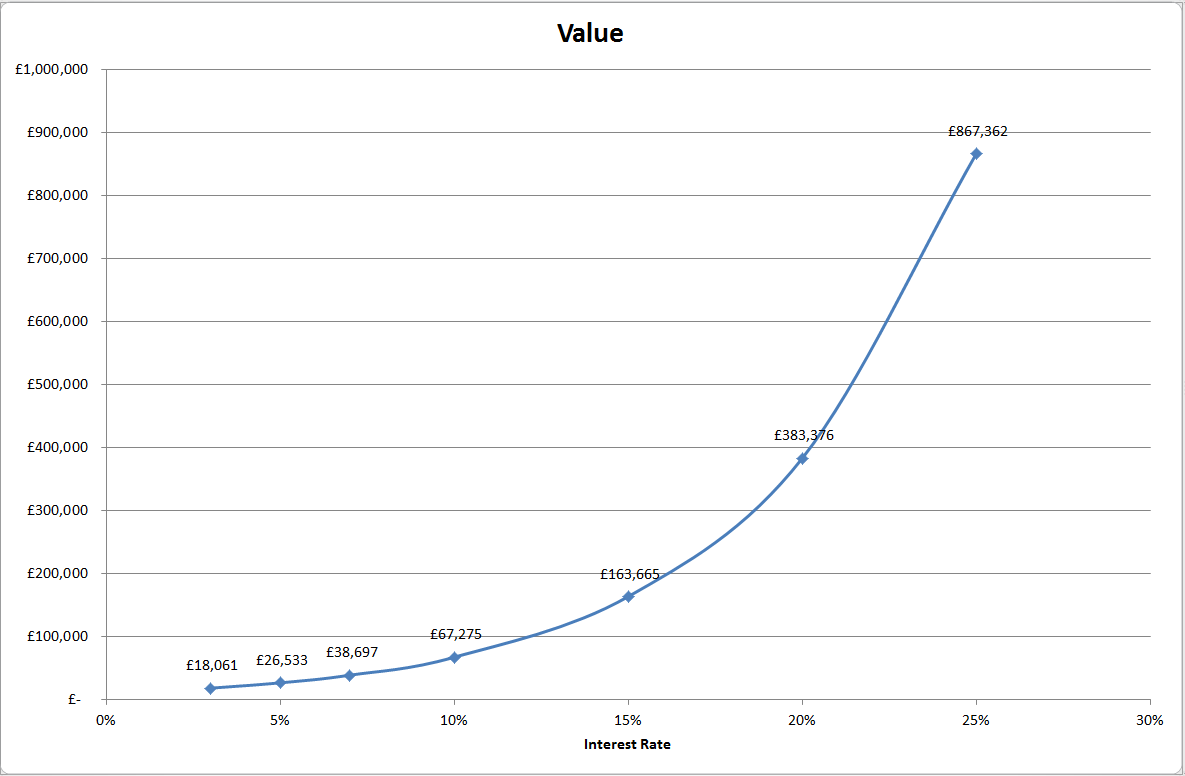
Note once again how relatively modest changes to the interest rate have a dramatic effect on returns, over an extended period of time. E.g increasing the rate from 7% to 10% increases returns from £38,697 to £67,275, a 74% improvement. An important corollary to this is that the effect of charges by funds or advisers is disproportionate. E.g. if the underlying return on an investment is 10% but an annual fee of 1.5% reduces this to an actual return of 8.5%, instead of earning £67,275 you will earn £51,120 – a cost of £16,155 over the lifetime of the investment.
Compound Interest Calculation
There are many websites offering compound interest calculators. Here is an example of a nice simple one, that lets you calculate any of a number of types of result, given knowledge of the other relevant factors. E.g. given a target final sum and a known investment period, it can calculate the rate of return you’d need to achieve to reach that target.
All spreadsheet software offers a range of formulae to perform compound interest calculations. These are a vital part of the investor’s armoury and let you easily perform numerous analyses of the performance of your investments.
One of the most useful (but little known) functions in Excel for investment analysis is the XIRR function. It can be used to calculate the equivalent rate of return that a known/anticipated series of cashflows represents. Note that XIRR is built-in to Excel 2010 and later versions. In earlier versions, it is part of the (free) Analysis Toolpak, which must be added in before the function can be used.
The following Excel2010 spreadsheet illustrates how the XIRR function is used to perform a practical investment analysis.
This spreadsheet calculates the anticipated investment return of a specialist investment trust: Doric Nimrod Air Two (aka “DNA2”) [it also includes an equivalent worksheet for a similar trust, DNA3]. The DNA2 trust operates on a simple basis: it owns 7 Airbus A380 “superjumbo” aircraft, all of which are leased to the Emirates airline (one of the world’s largest airlines). Emirates operates the world’s largest fleet of A380s, totalling 75 aircraft.
Each aircraft is leased for a period of 12 years, and the leases are structured such that the regular lease payments are sufficient to:
a) Pay a dividend to investors in the trust
b) Fully repay debt finance (with interest) that DNA2 has taken on to purchase the aircraft. This debt is “amortising”, i.e. operates like a repayment mortgage with the debt repayments including both an interest and a capital component, and structured such that the debt will be fully repaid over the duration of the lease.
So, at the end of the lease terms, DNA2 will own the aircraft unencumbered by debt, and it is anticipated that the aircraft will be sold or otherwise disposed of, returning proceeds to investors in DNA2.
In the DNA2DNA3GRY sample spreadsheet, the entry in row 3 represents the current share price of DNA2 shares (in pence). Subsequent rows (4-34) represent regular dividend payments that the trust is expected to make (4.5p per quarter). The figures representing payments to investors are negative for XIRR to work, with the initial investment (i.e. the share purchase) being a positive number. Note that the (apparently attractive) simple annual yield on the trust at the price of 220p is 4*4.5 (=18)/220 = 8.2%… but this is not the whole story. What you need to know as an investor is the “gross redemption yield” (GRY) that can be expected from DNA2, i.e. what the compound rate of return on your money is, if held to maturity when the aircraft are ultimately sold.
A major factor in establishing the GRY is the anticipated sum that will be received when the aircraft are ultimately sold. DNA2 have commissioned 3 independent specialist valuers to provide an estimate of this each year – but note that this estimate is highly uncertain because there is not yet an established market for used A380 aircraft, given that the aircraft is a relatively new type.
Row 34 represents an estimate of the terminal value per share that shareholders will receive – note that both the precise date when this will be repaid, and the amount are uncertain and will depend on the market for the aircraft in 2025. The XIRR function in cell 1E uses:
- The initial purchase price;
- The regular dividend payments; and
- The estimated terminal value
to calculate the equivalent GRY for the purchase of shares in the trust. By changing the estimated terminal value and the final redemption date (both of which are uncertain), you can examine the sensitivity of the GRY to changes in those parameters and hence form a view of the attractiveness of the investment (and at what share price it would appear attractive to you).
Note that the dividend payments are not guaranteed, but have been paid as anticipated to date. It is hard to see a reason for them not to be paid, barring a collapse of the Emirates airline.
Mark Bentley